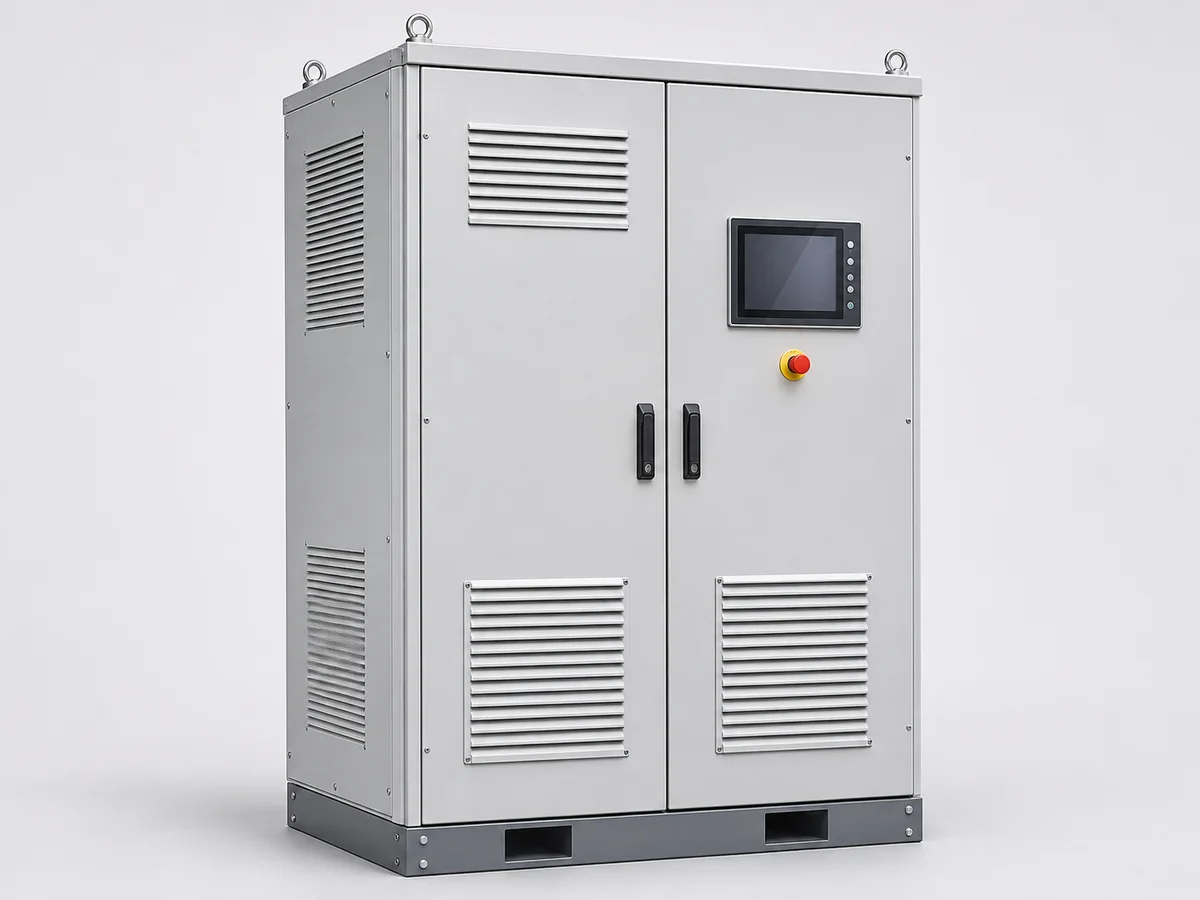
S-Curve Progress Monitoring for a Wind Power Station
Planned-versus-actual S-curve reporting for a wind power station, showing 37.40% actual against 36.06% planned in April 2024.
Challenge
A wind power station needed progress tracked across site studies, design, WTG procurement (nacelle, blades, hub, service elevator, tower bolts) and construction.
Approach
Monthly cumulative S-curves from January to November 2024 were built in Primavera P6 and Excel for each sub-category.
Result
At the April 2024 data date, overall progress was 37.40% against 36.06% planned, with design, procurement and construction all slightly ahead of plan.
Scope of Work
- Planned versus actual S-curves
- Sub-category progress tracking
- WTG procurement tracking
Deliverables
- S-curve progress report
Similar projects
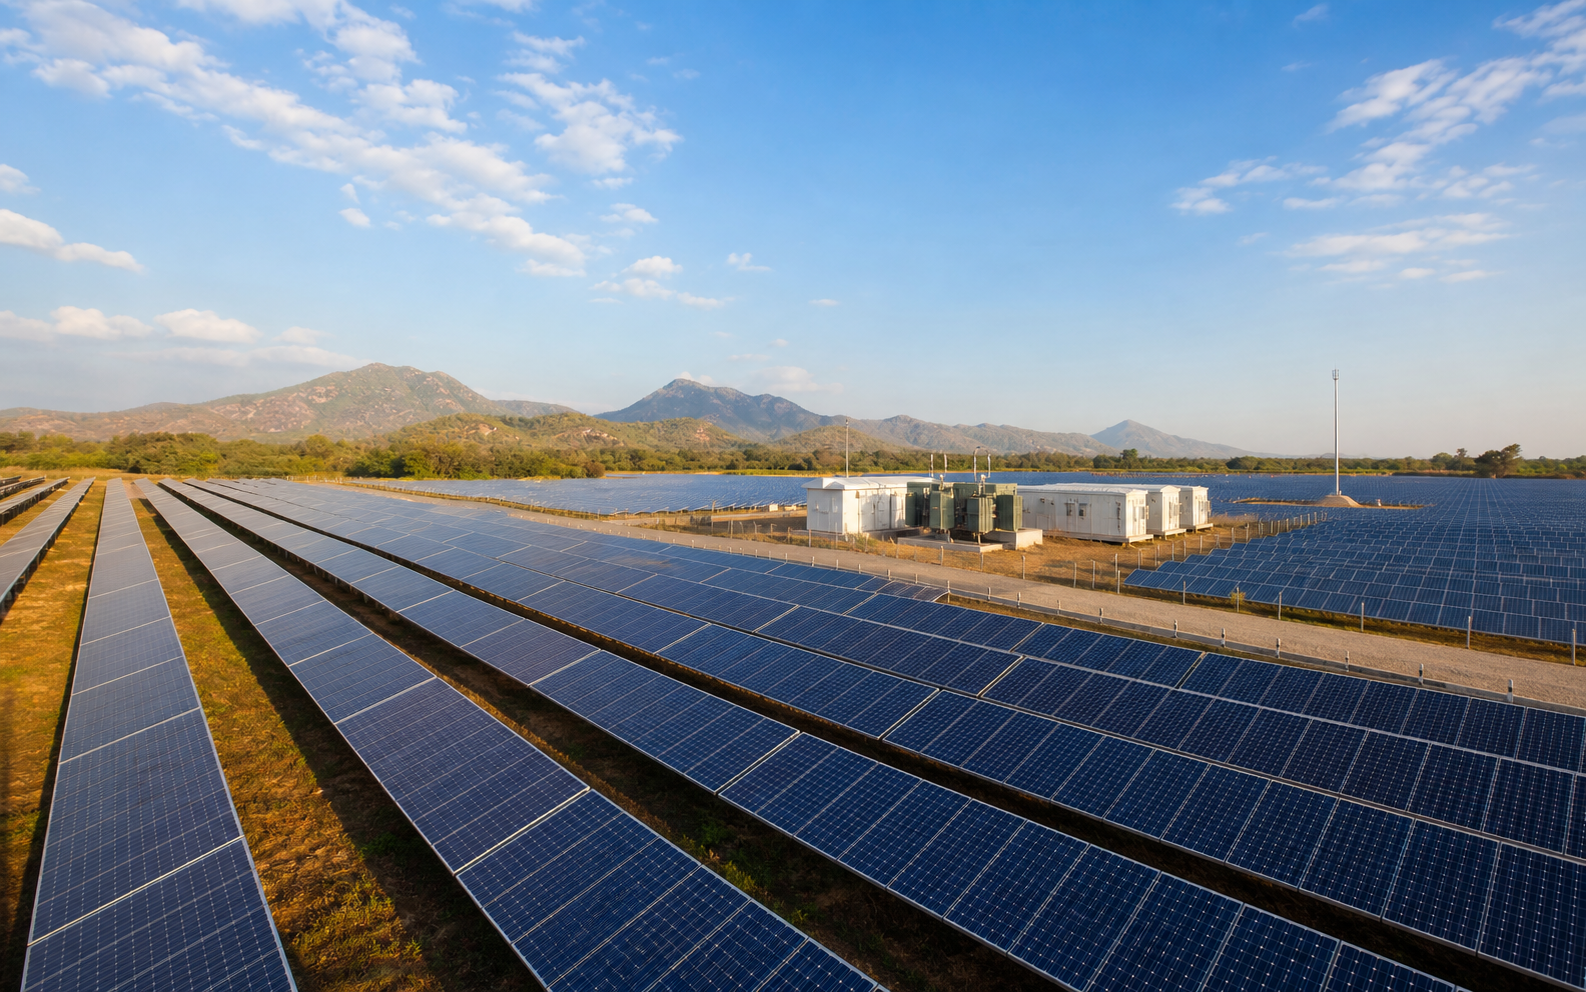
1.3 GWac Utility-Scale Solar PV Plant Design in Colorado
RatedPower design of Inovateus Solar's 1.33 GWac Kendall Ranch: 151 power stations, 40,678 trackers, 3.41 TWh in year 1 and PR 87.03%.
41.6 GWh Commercial Solar Plant Energy Yield Simulation in PVSyst
PVSyst v7.4.8 simulation for the TCP Godowns solar plant: 41.6 GWh a year to grid, P50 1,724 kWh/kWp and PR 82.29%.
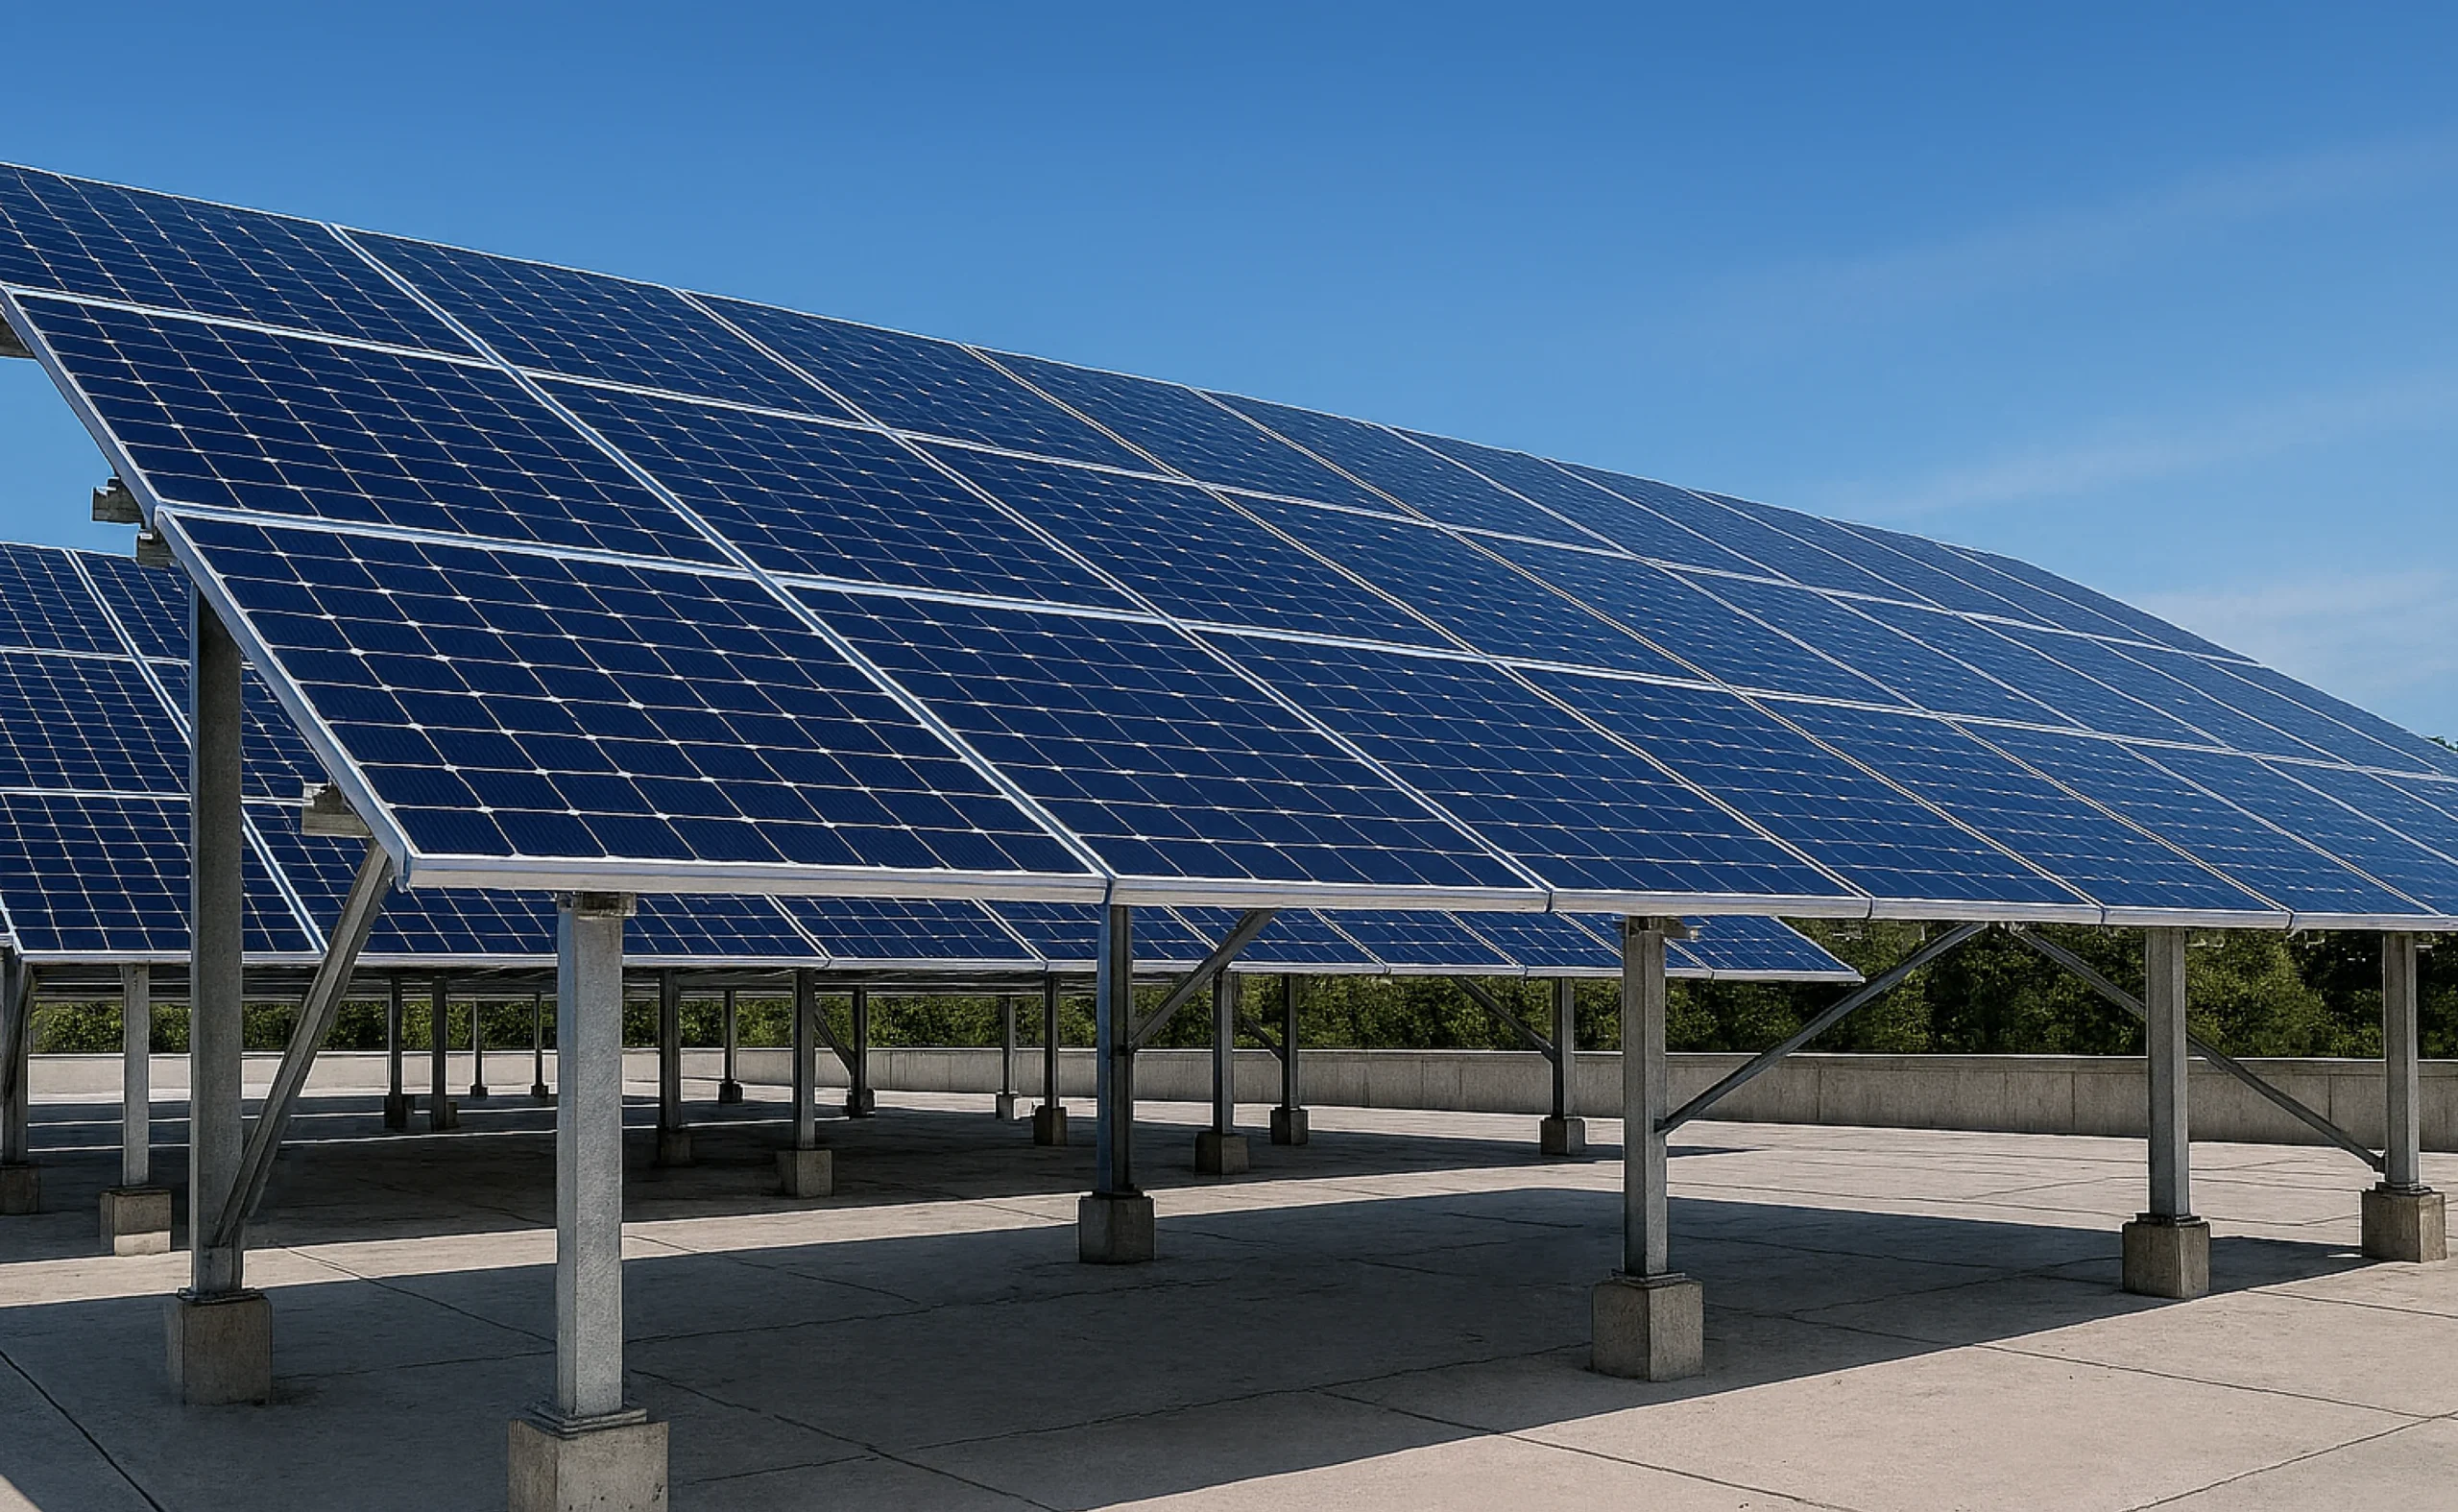
296 kW Elevated Commercial Rooftop Solar PV Design
PVSyst-simulated 296 kW elevated rooftop system with 501 × 590 W modules on chemically anchored steel structure, plus layout and wiring drawings.
Let's Build Something Great Together.
Partner with Fluxiss for engineering that holds up - under pressure, under load, under scrutiny.